

“Up and to the right” – that’s what every business owner and marketing manager wants to see when looking at graphs showing their business performance.
I lead a team of digital marketers who love helping clients grow their businesses, and “up and to the right” is what we want to see too.
But what if the graph for an important KPI drops, such as “overall conversion rate”?
Sometimes I have seen clients deeply concerned about a drop in the overall conversion rate on their website. The monthly Google Analytics report arrives in their inbox and if the conversion rate has dropped there is a sudden panic. Or the Marketing Manager has presented a website performance summary to the Board of Directors, who raise concern about a drop in overall conversion rate.
But looking at the overall conversion rate on your website is the wrong metric to be focused on.
I know this sounds strange. At first impression, the overall website conversion rate sounds like a robust KPI. But this thinking is actually misguided. Here’s why: You could have a sharp decline in the overall website conversion rate and yet increase overall sales.
We had an ecommerce client who experienced this. Their sales from our digital ad campaigns had just achieved their best month ever. Yet their conversion rate was down.
We had another client whose campaigns were focused on leads rather than online sales. They had 140% more leads than just four months earlier, yet their overall website conversion rate was now half of what it was those four months prior. How can that be?
The short answer was that we had increased the amount of display ads (image ads) that were being run for these clients.
Display ads are different to Google search ads. If you search for something on Google you are shown text-based search ads on the search engine results page that match what you were searching for. When people click on these ads we call this “high intent traffic” because they were intentionally searching for something and the ad matches what they are searching for.
In contrast, display ads do not show on search results pages. Instead display ads are image ads that sit alongside content on websites such as news sites, YouTube, blog sites, TradeMe and millions of other sites. When people see these ads they are not actively searching for what you are offering. However, some who see it are interested enough to click it. We call this traffic “low intent traffic”.

The good thing about display ads is that they can generate a lot of traffic to your site very cheaply. However, the downside of traffic from display ads is that because the traffic has lower intent, it has a much lower conversion rate than other forms of traffic.
So when we increased the amount of display traffic coming to these websites it decreased the overall conversion rate. However, it also helped increase the number of sales/leads from the sites, for the same amount of money spent.
This is why it’s not just about overall conversion rate. It’s about the total sales and profit.
Even though the conversion rate is much lower with display ads, the cost of the traffic is very cheap and can generate good numbers of customers. Some of the traffic will buy or enquire straight away, and for the ones that don’t, they have now been exposed to your brand and products/services. This positions your company in their mind as a solution, and some of these users will return to your website two or three times and then convert to being a customer.
If you were focused on the overall conversion rate, you would want to turn off display advertising. However, this can decrease the total amount of sales/leads you get from your advertising.
So, if the overall conversion rate is not the right KPI, what figures should you look at?
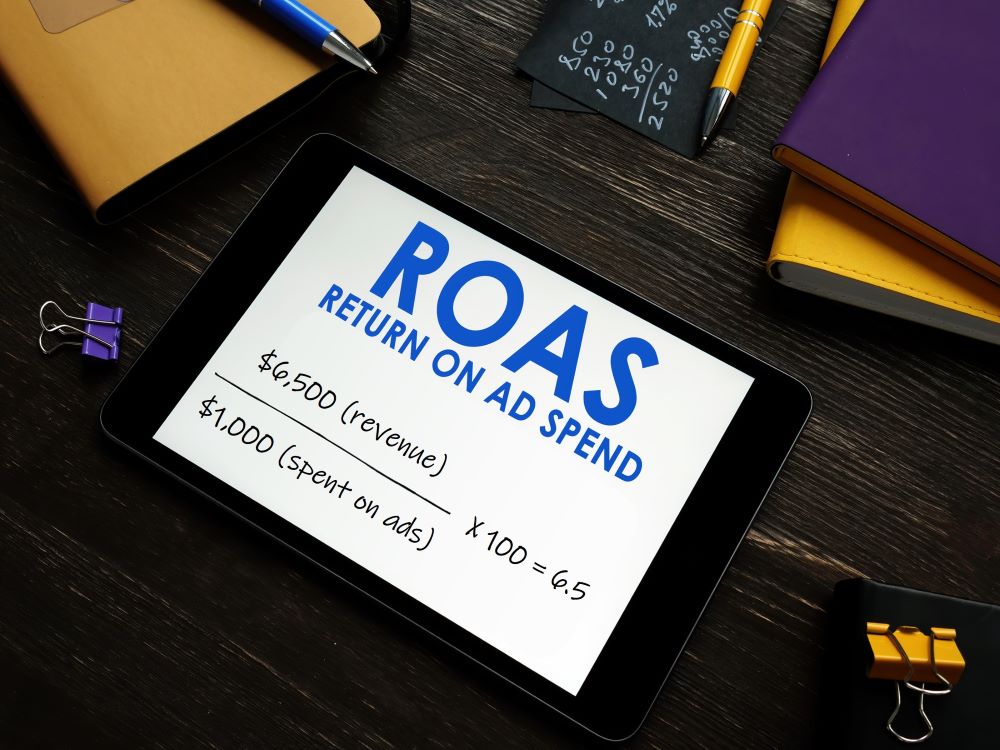
Firstly, for ecommerce sites, I recommend you view the Return On Ad Spend (ROAS) figure. This is the total revenue generated from ads divided by the total cost of the ads. For example, if you spent $1000 on digital ads and this generated $6500 in ecommerce revenue, your ROAS is 6.5. The higher the number the better the return. This is the most important overall KPI to focus on.
Alternatively, for lead-focused businesses the best KPI would be the Cost Per Acquisition (CPA) – which is the total ad spend divided by the number of leads. If you spent $1000 on ads and received 20 leads you have a CPA of $50 per lead.
These are the best top-level figures to compare month to month.
When it comes to conversion rates, they are still important. Just don’t get distracted by the “overall conversion rate”. There are two useful ways you could approach this.
Firstly, for an overall figure of website performance I recommend Directors and owners look at a filtered overall conversion rate, with display ads traffic filtered out. This will give a reliable overall conversion rate figure that can be compared month-to-month.
Secondly, marketing managers who want to delve into the detail can look at the month-to-month conversion rates for each traffic source. For example, you can compare the conversion rate for organic traffic month to month, and separately compare the conversion rate for Google search ads month to month. This means you’re comparing apples with apples.
By choosing the right KPIs, you can keep your finger on the pulse and make good decisions that result in long-term success.